Business inventories and GDP set the stage for understanding how the products that companies keep on hand connect directly to the economic heartbeat of a nation. This relationship shapes how we interpret shifts in growth, predict trends, and respond to the ups and downs of the business cycle. By tracking inventory levels and watching how they flow through supply chains, we unlock a behind-the-scenes look at what’s really driving changes in GDP.
In this exploration, we’ll break down the meaning of business inventories, the different ways they’re measured, and their crucial role in supply chains. You’ll see how businesses track these numbers, how they report them, and how even minor changes can ripple through the economy. We’ll also take a closer look at how inventory cycles mirror economic expansions and recessions, which indicators to watch, and how smart inventory management can help companies and countries alike weather economic storms.
Business Inventories and GDP: Understanding Their Connection in the Economy
Business inventories play a vital role in economic systems, serving as a buffer between production and consumption. Their management and fluctuations provide key insights into the functioning of supply chains and the health of the broader economy. Understanding how business inventories interact with Gross Domestic Product (GDP) reveals why economists and policymakers closely monitor inventory data to anticipate economic trends and make informed decisions.
Definition and Role of Business Inventories in the Economy
Business inventories refer to the goods and materials that companies hold for the purpose of resale, production, or maintenance. These inventories are categorized by their stage in the production process and their function within a business’s operations.
| Type of Inventory | Description | Example |
|---|---|---|
| Raw Materials | Items purchased for use in the production of finished goods. | Steel for car manufacturers |
| Work-in-Process (WIP) | Goods that are partially completed but not yet ready for sale. | Assembled car frames |
| Finished Goods | Products ready for sale to customers or distributors. | Automobiles on dealer lots |
| Maintenance, Repair, and Operations (MRO) | Supplies used in production but not part of the final product. | Lubricants, cleaning supplies |
Within supply chains, inventories allow businesses to meet unexpected demand, mitigate supply disruptions, and optimize production cycles. On a macro level, the total inventory holdings across sectors reflect business confidence and the anticipated pace of economic activity. Companies regularly track inventory through stock counts, barcode scanning, and inventory management software, while reporting them in financial statements under current assets.
The Relationship Between Business Inventories and Gross Domestic Product (GDP)
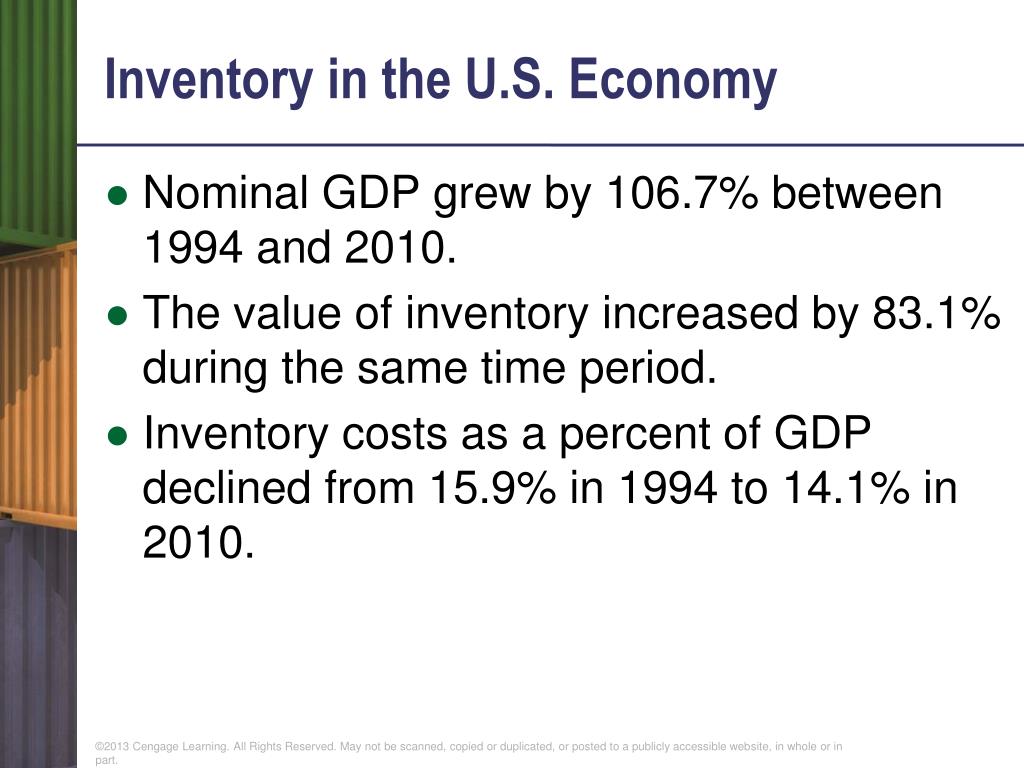
Changes in business inventories are a key component of GDP calculations. When businesses increase their inventories, it signals an investment in future sales and contributes positively to GDP. Conversely, a decrease in inventories—often called “inventory drawdown”—can reduce GDP growth in the short term, as it indicates businesses are selling off stock faster than they are replenishing it.
| GDP Component | Description | Role of Inventories |
|---|---|---|
| Consumption | Spending by households on goods and services | Indirectly affected if inventory shortages occur |
| Investment | Business spending on fixed assets and inventory changes | Inventory build-up increases this component |
| Government Spending | Expenditures by the government sector | Not directly linked to inventories |
| Net Exports | Exports minus imports | Exported inventories add to GDP |
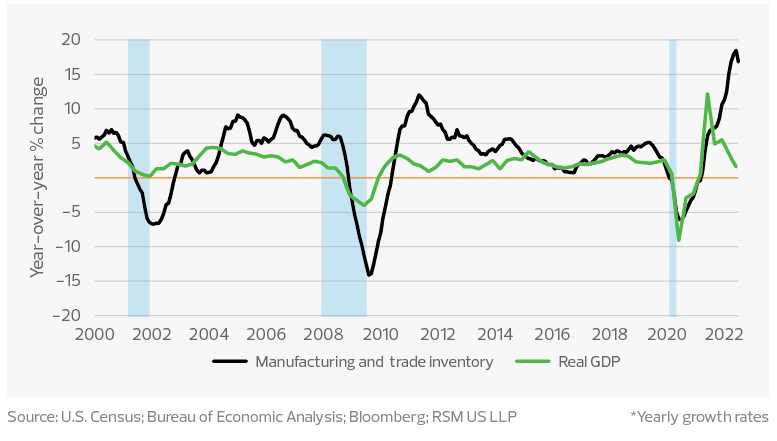
For example, during a period of economic expansion, businesses may increase inventories in anticipation of strong sales, boosting GDP. In contrast, during a recession, firms may scale back inventory accumulation or liquidate existing stock, which can dampen GDP growth.
Inventory Cycles and Economic Fluctuations, Business inventories and gdp
Inventory cycles are closely tied to business cycles, including periods of expansion, peak, contraction, and recovery. As economic activity accelerates, companies build up inventories to meet projected demand. However, if demand falls short of expectations, excess inventory can trigger production slowdowns and even layoffs, amplifying economic downturns.
| Year/Period | Economic Event | Inventory Response |
|---|---|---|
| 2008-2009 | Global Financial Crisis | Sharp inventory liquidations, production cuts in manufacturing and retail |
| 2020 | COVID-19 Pandemic | Disrupted supply chains led to both shortages and excesses in different sectors |
| 2010-2012 | Post-recession Recovery | Restocking of inventories contributed to GDP rebound |
Effective inventory management can help businesses adjust more smoothly to these cycles, cushioning the impact of volatility. Poorly timed inventory adjustments, on the other hand, can exacerbate swings in production and employment.
Methods of Inventory Measurement and Reporting

Businesses use various methods to measure and report their inventories, each with implications for financial results and tax liabilities. The choice often depends on industry norms and regulatory requirements.
| Inventory Method | Description | Common Usage |
|---|---|---|
| FIFO (First-In, First-Out) | Assumes oldest inventory is sold first; ending inventory reflects recent costs. | Retail, perishable goods industries |
| LIFO (Last-In, First-Out) | Assumes newest inventory is sold first; ending inventory reflects older costs. | Some US wholesalers, non-perishable goods |
| Weighted Average | Costs are averaged for all units; smooths out price fluctuations. | Manufacturing, commodities |
Businesses typically report inventories on the balance sheet as a current asset. The valuation method chosen affects cost of goods sold (COGS) and net income, impacting tax obligations and profitability.
- Retailers often favor FIFO to reflect the real cost of fast-moving goods and avoid inventory obsolescence.
- Manufacturers may choose weighted average to handle bulk purchases with fluctuating costs.
- Industries dealing with commodities may use methods aligned with market price volatility.
Macroeconomic Indicators Related to Business Inventories

Monitoring inventory data is vital for understanding both sector-specific dynamics and overall economic performance. Government agencies frequently release economic indicators based on inventory levels, which help analysts gauge trends in production, sales, and supply chain management.
| Indicator | Source Agency | Release Frequency | Coverage |
|---|---|---|---|
| Manufacturing and Trade Inventories and Sales (MTIS) | U.S. Census Bureau | Monthly | Retail, wholesale, manufacturing sectors |
| Business Inventories Report | U.S. Census Bureau | Monthly | Aggregated business sectors |
| GDP Inventory Change Component | Bureau of Economic Analysis (BEA) | Quarterly | National accounts |
| Inventory/Sales Ratios | Various statistical agencies | Monthly/Quarterly | Industry breakdowns |
Policymakers and financial analysts closely interpret these figures to identify early signs of economic shifts. Rising inventories relative to sales may signal weakening demand, while falling inventories can indicate strong consumption or supply chain bottlenecks.
Strategic Inventory Management and Its Economic Implications

Efficient inventory management has both microeconomic and macroeconomic impacts. Businesses strive to optimize inventory levels to minimize costs and maximize service quality. Strategic approaches include just-in-time (JIT) systems, safety stock calculations, and advanced forecasting.
- Economic advantages of optimal inventory holdings:
- Reduced storage and holding costs
- Improved cash flow and liquidity
- Enhanced ability to respond to shifting demand
- Risks of mismanaged inventory:
- Excess inventory leading to obsolescence and markdowns
- Insufficient inventory causing stockouts and lost sales
- Strained supplier relationships from erratic ordering
Industries like automotive, electronics, and retail are particularly sensitive to changes in inventory levels, with direct implications for GDP when inventory swings trigger production adjustments.
Illustrative Scenarios: Business Inventories During Economic Shocks
Economic shocks—such as financial crises or sudden supply chain disruptions—dramatically alter inventory dynamics. During these periods, companies may be forced to rapidly adjust production, ordering, and inventory strategies to survive.
| Sector | Shock Event | Inventory Response | Economic Signal |
|---|---|---|---|
| Automotive | 2020 Pandemic Shutdowns | Rapid depletion of dealership stock due to supply chain breaks | Signaled deeper supply chain vulnerabilities |
| Retail | Financial Crisis 2008 | Massive inventory liquidations to maintain liquidity | Contributed to broader economic contraction |
| Technology | Semiconductor Shortage (2021) | Critical inventory shortages halted production across industries | Highlighted the global interdependence of supply chains |
Significant inventory adjustments during such events can be leading indicators of either a recovering or contracting economy, depending on the direction and pace of changes in stock levels across sectors.
Summary
Wrapping up, the connection between business inventories and GDP is more than just a statistical detail—it’s a living pulse that reveals the health and direction of the broader economy. Understanding how inventories move, why they matter, and how they’re managed gives valuable insights for businesses, analysts, and anyone interested in economic trends. The next time you hear about stockpiles rising or falling, you’ll know just how much it matters for the bigger economic picture.
FAQ Compilation
What are business inventories?
Business inventories are the goods and materials that companies keep on hand to sell or use in production, including raw materials, work-in-progress, and finished products.
How do changes in business inventories affect GDP?
Changes in business inventories are factored into GDP; an increase adds to GDP growth while a decrease can subtract from it, reflecting changes in production and demand.
Why do companies hold inventories?
Companies hold inventories to meet customer demand, manage supply chain delays, prepare for seasonal fluctuations, and maintain smooth operations.
What is the difference between FIFO and LIFO inventory methods?
FIFO (First-In, First-Out) assumes the oldest inventory is sold first, while LIFO (Last-In, First-Out) assumes the most recently acquired inventory is sold first; this affects financial reporting and tax calculations.
Are business inventories a leading indicator of economic trends?
Yes, changes in inventory levels often signal upcoming shifts in economic activity, as businesses adjust their stock in anticipation of demand changes or economic conditions.
